
Common Size Balance Sheet: Definition, Analysis, Format and Example


Definition

Common size analysis, also referred as vertical analysis, is a tool that financial managers use to analyse financial statements. It evaluates financial statements by expressing each line item as a percentage of the base amount for that period. The analysis helps to understand the impact of each item in the financial statement and its contribution to the resulting figure.
The technique can be used to analyse the three primary financial statements, i.e., balance sheet, income statement and cash flow statement. In the balance sheet, the common base item to which other line items are expressed is total assets, while in the income statement, it is total revenues.

What is Common Size Balance Sheet Analysis?

The term “common size balance sheet” refers to the presentation of all the line items in a balance sheet in a separate column in the form of relative percentages of total assets, primarily. This technique is convenient for comparison of the number of assets, liabilities and equity among different companies, especially when they are used for an acquisition analysis.

It is convenient to build a common size balance sheet as it helps in building trend lines to discover the patterns over a specific period. In short, it is not just an upgraded variety of the balance sheet per se, but it also captures each single line item as a percentage of total assets, total liabilities and total equity besides the usual numeric value.

Format and Example

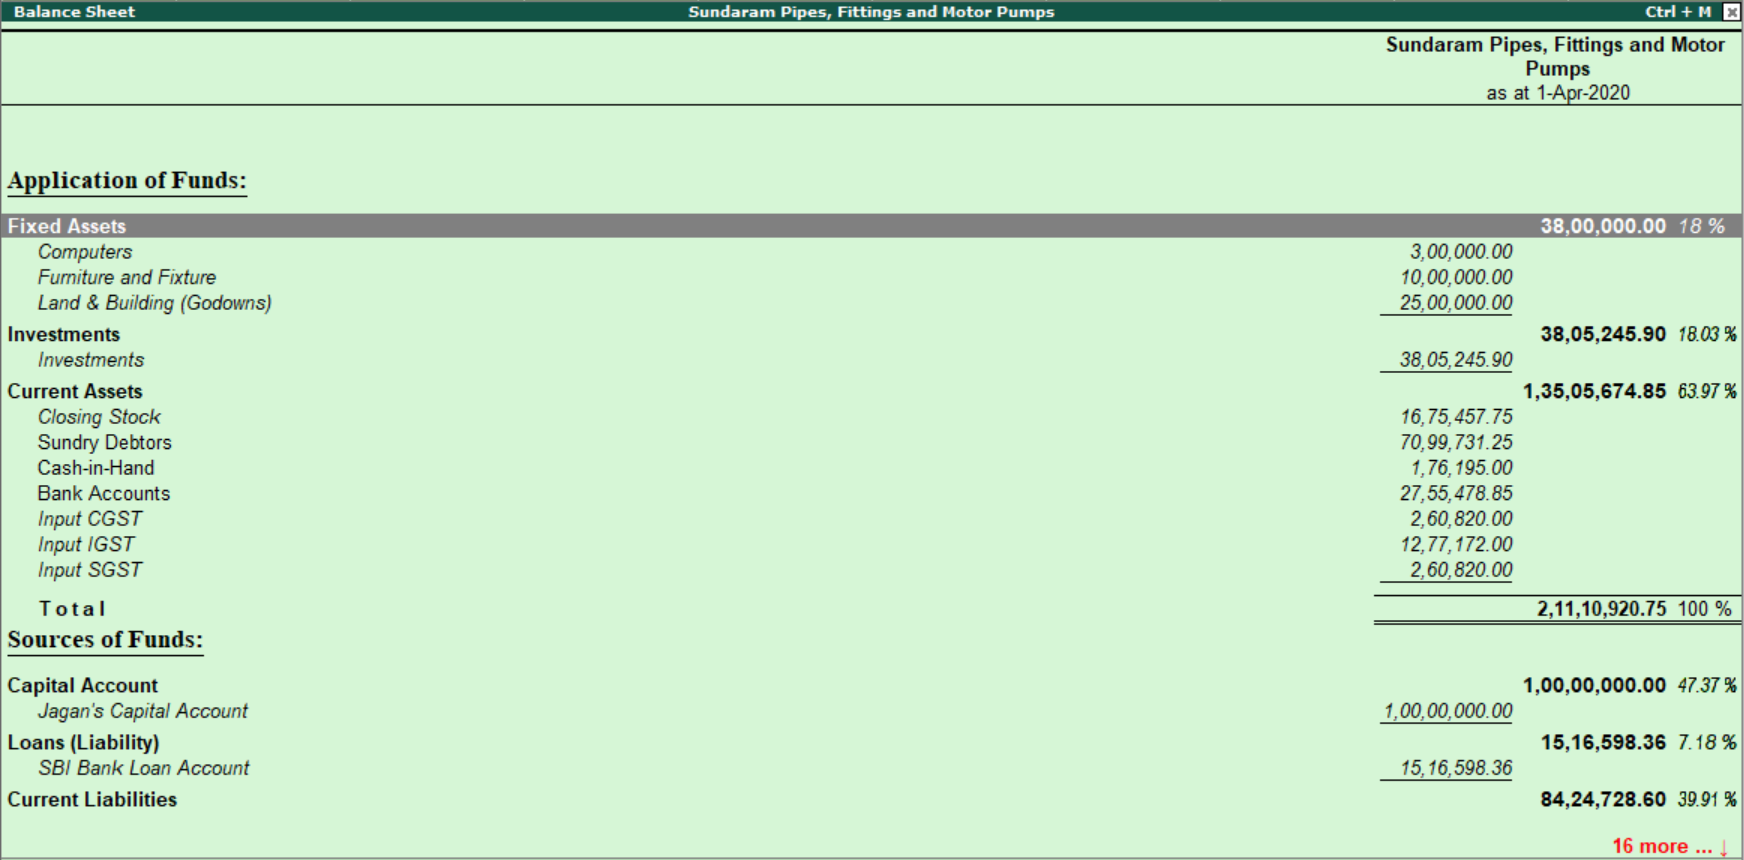
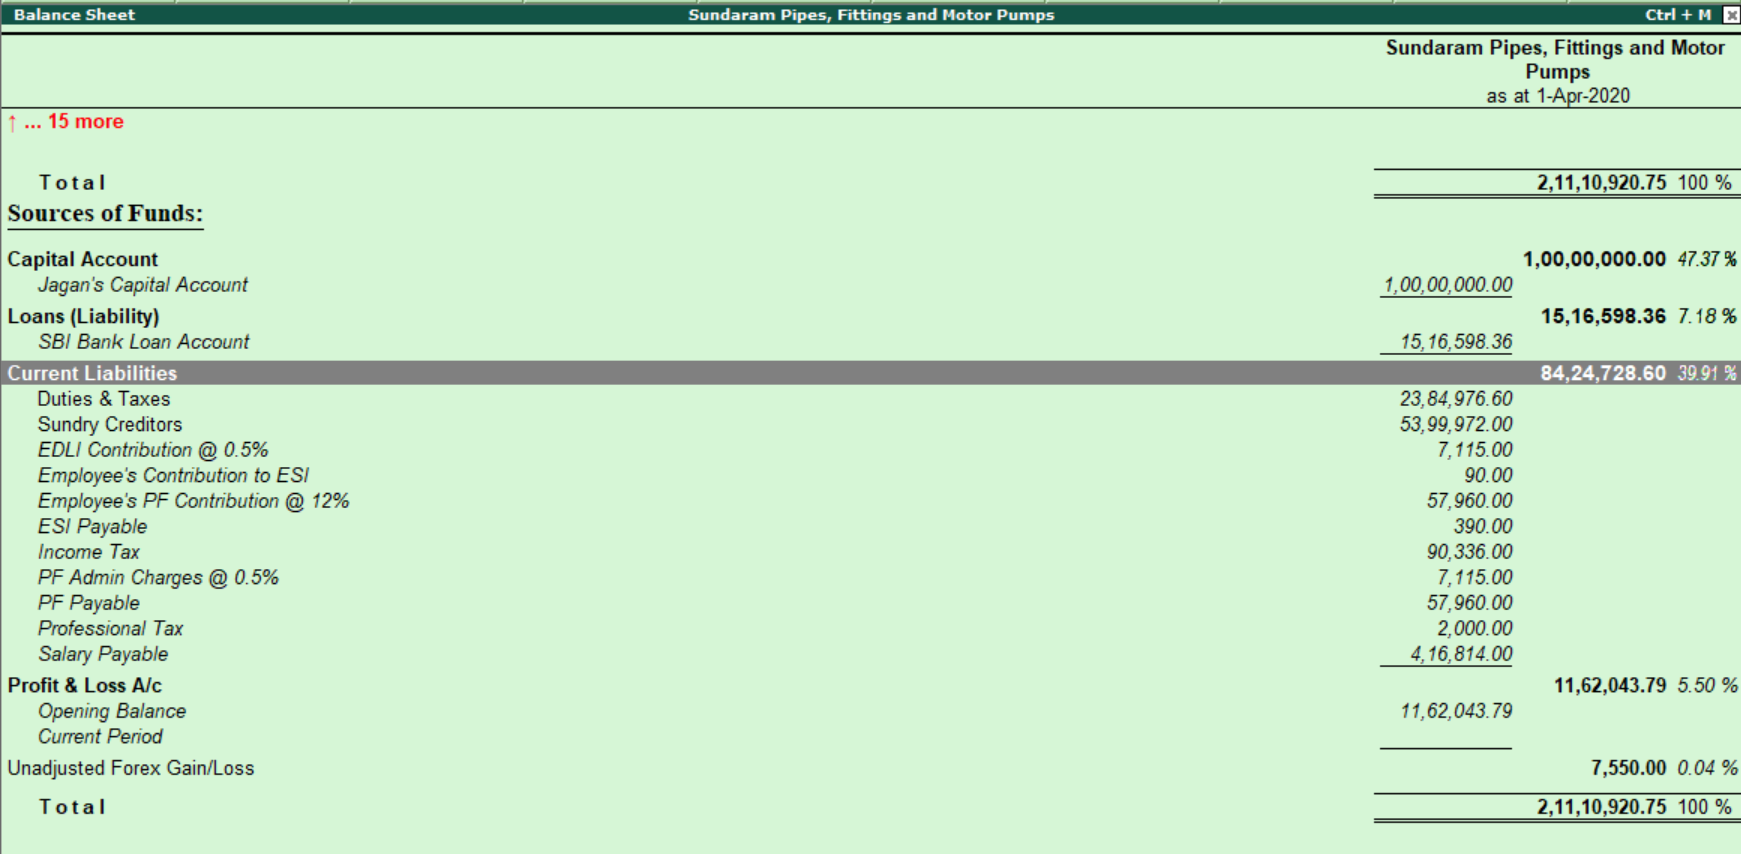
Let’s look at the common size vertical format balance sheet of Sundaram Pipes, Fittings and Motor Pumps.

As you can see that a common size balance has drawn comparisons between assets and liabilities and even called out the percentage of the base amount for that period. The analysis helps to understand the impact of each item in the financial statement and its contribution to the resulting figure.

Balance sheet format

Balance sheet format

As you can see that a common size balance has drawn comparisons between assets and liabilities and even called out the percentage of the base amount for that period. The analysis helps to understand the impact of each item in the financial statement and its contribution to the resulting figure.

Here are some of the advantages of Common Size Balance Sheet analysis

  • It aids the reader of the statement to understand clearly the ratio or percentage of each individual item in the statement as a percentage of total assets of the company
  • It aids a user to determine the trend related to the percentage share of each item on the asset side and percentage share of each item on the liability side
  • A financial user can also use it to compare the financial performances of different entities at a glance since each item is expressed in terms of percentage of total assets, and the user can determine any required ratio quite easily

Comments

Popular posts from this blog

Break Even Point: Definition, Formula, Example and Analysis

What is the Break-Even Point? A simple financial tool which helps you determine at what stage your company, or a new service or a product, will be profitable. To put simply, break-even point analysis will tell you the number of products or services a company should sell to cover its costs, particularly fixed costs. Break-even is a situation where you are neither making money nor losing money, but all your costs have been covered. Break-even analysis is useful in studying the relation between the variable cost, fixed cost and revenue. Generally, a company with low fixed costs will have a low break-even point of sale. For example, a company has a fixed cost of Rs.0 (zero) will automatically have broken even upon the first sale of its product. The purpose of the break-even analysis formula is to calculate the amount of sales that equates revenues to expenses and the amount of excess revenues, also known as profits, after the fixed and variable costs are met. The main thing to understand i...

Business Report: Definition, Format and Example

Any business, irrespective of the size needs to be organised to achieve its goal, whatever it maybe. A well-structured firm has more chances to achieve success and sustain for a prolonged period in the market as compared to a disorganised business. Each department needs to be tracked and analysed on a timely basis so that various business decisions can be taken appropriately. Since most businesses are a part of an ever-changing environment, it is crucial to roll and embrace the changes. And if you want to be a part of such rapidly changing scenario, it is imperative to manage all business activities rigorously. As a part of staying afloat in a competitive space, the need of managing business reports arises. Businesses may gather financial, marketing and sales-related information, or more technical data; a business report sample will be your all-time assistance to adjust purchasing plans, staffing schedules, and more generally, communicating your ideas in the business environment. These...

Tally Shortcuts

To select a Company F1 To change the current date F2 To open Company features screen F11 To open configuration screen F12 To duplicate a voucher from list of vouchers Alt+2 To add a voucher in list of vouchers Alt+A To delete a voucher/master Alt+D To change the period Alt+F2 To create a master from a voucher Alt+C To close a company, to view a report in detail Alt+F1 To email details Alt+M To print the current screen Alt+P To export details in ASCII, Excel, HTML or XML format Alt+E To display previous voucher during voucher entry PgUp To come out of a screen Esc To open the calculator Ctrl+N To print the current screen Alt+P